THUG State of the City — August 2026
A public, anonymized read on where the city ran hottest: districts, markets, heists and ownership churn.
This State of the City dispatch summarizes public aggregates from the living simulation. Figures describe district- and system-level activity only. No player names, character identifiers or private account data are included.
Most active district
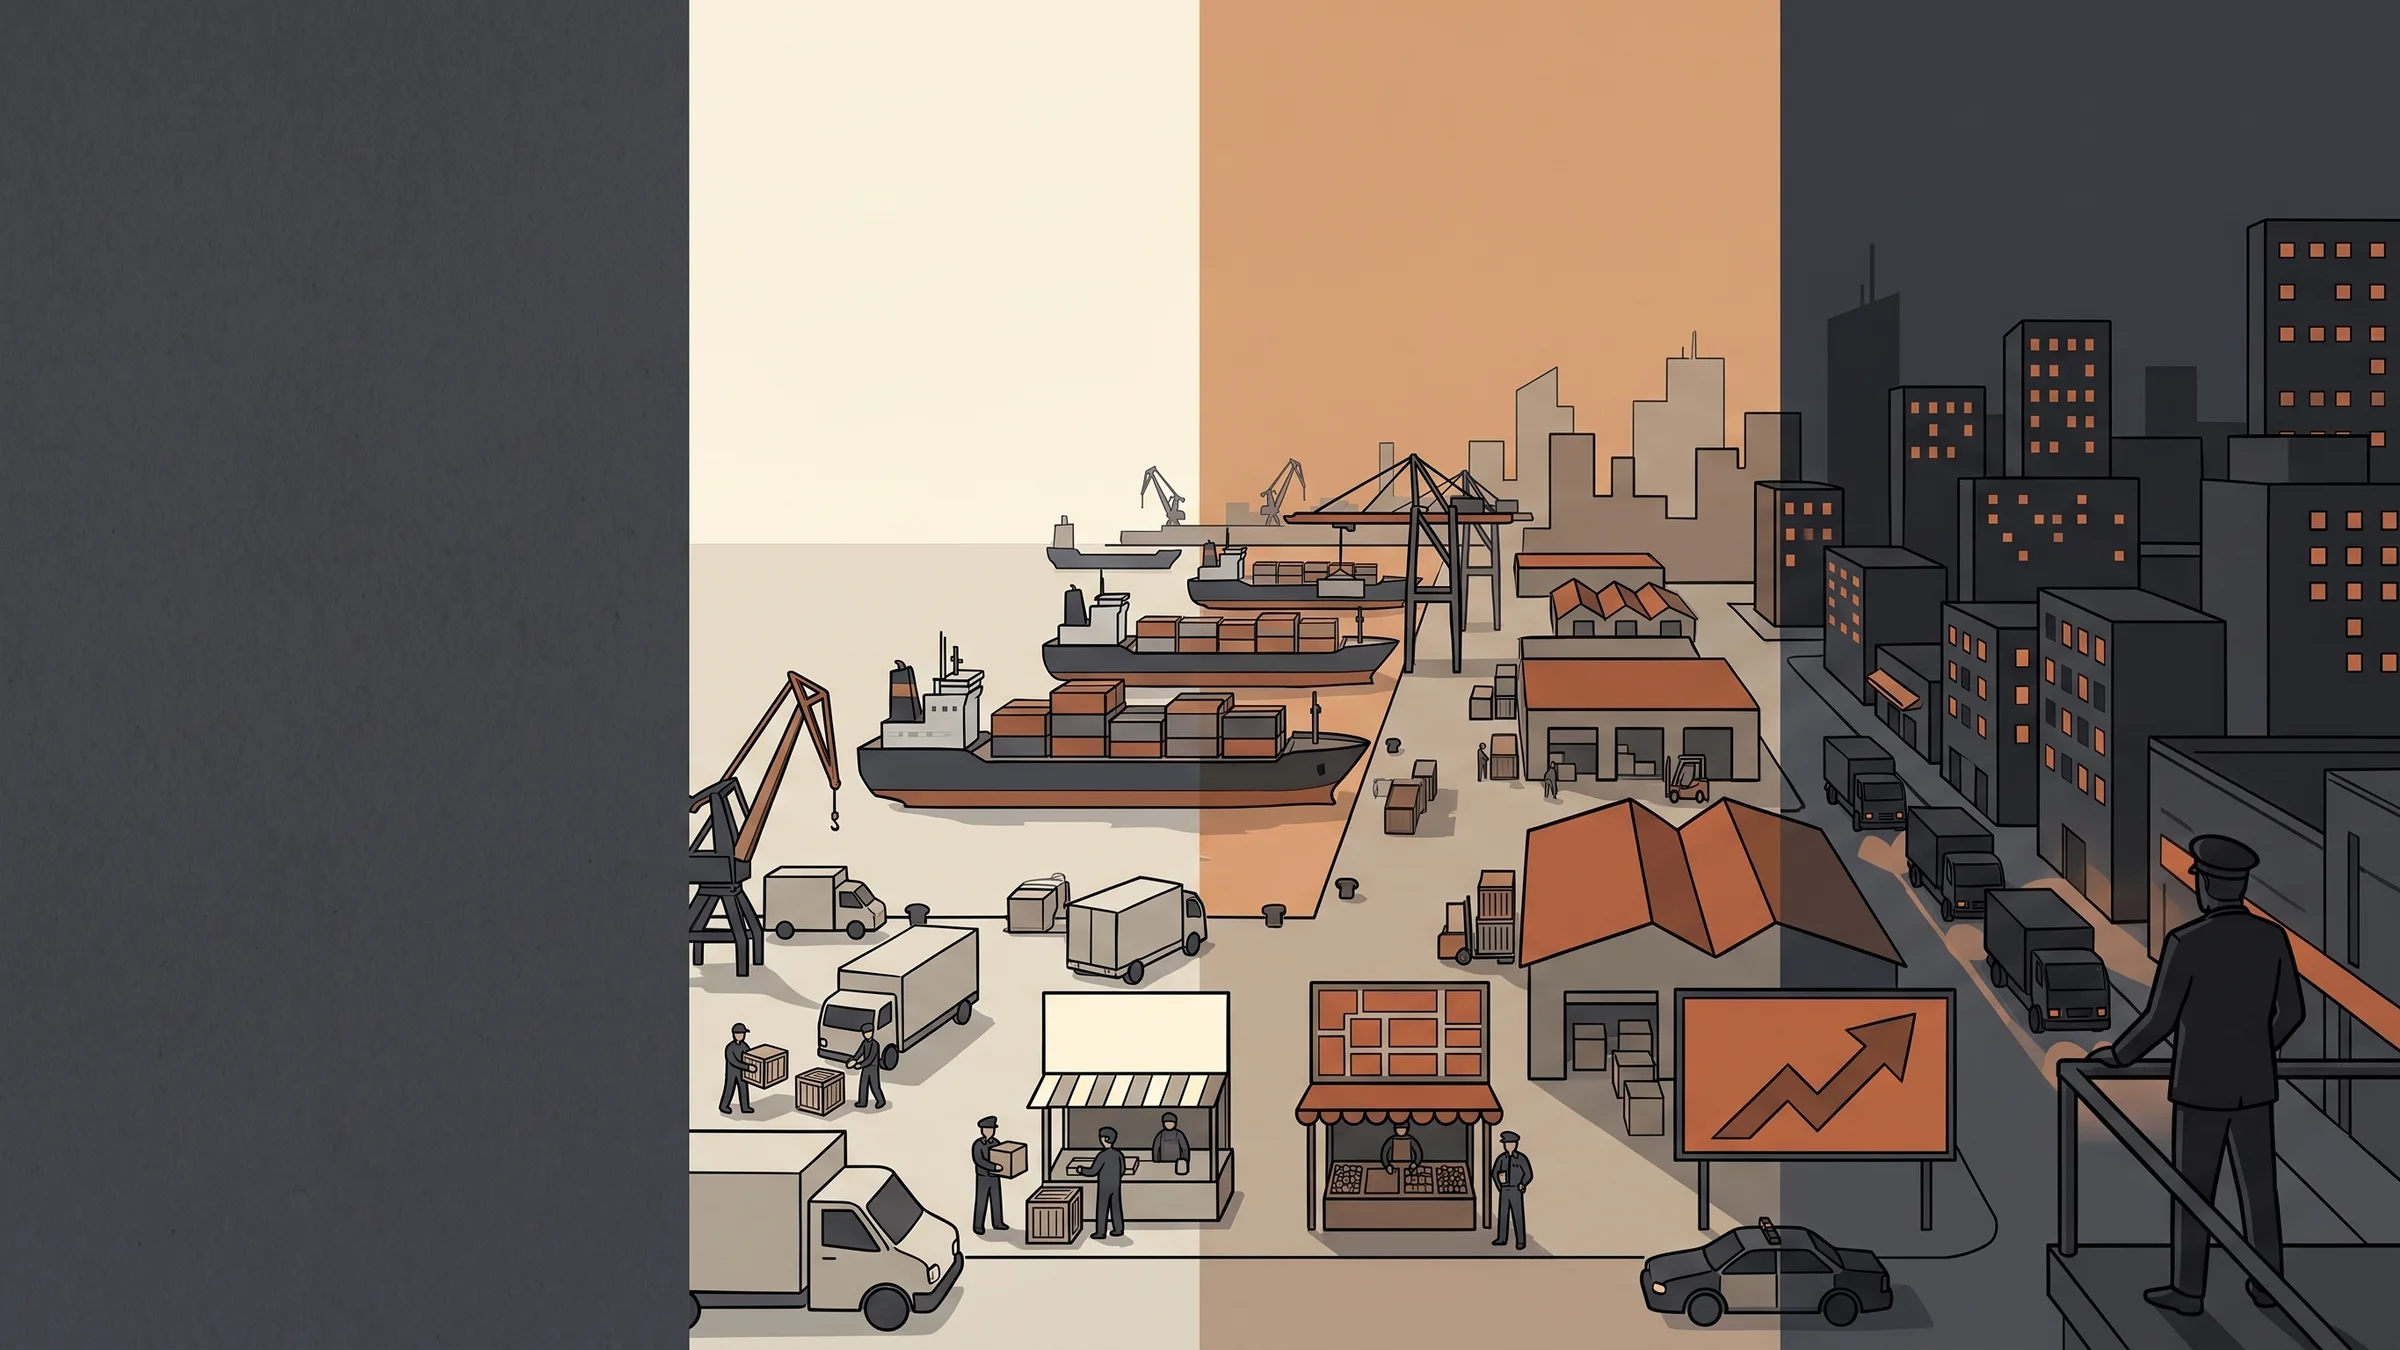
Public traffic and operational event density concentrated hardest in the Iron Docks through the latest reporting window, with Neon Mile close behind on night-cycle commerce and street jobs. North Blocks led daytime business operations; Diamond District stayed quieter but capital-heavy.
Activity here means aggregated system events—jobs resolved, market actions, organization moves—not a leaderboard of individuals.
- Iron Docks: highest combined logistics and street event volume
- Neon Mile: strong night-cycle commercial and social traffic
- North Blocks: leading share of business operation ticks
Business resale and ownership churn
The business resale market cleared a healthy mid-tier volume: enough listings to give buyers choice, not so many that districts looked abandoned. Aggregate transfer counts show ownership changes clustered around storefront and light logistics sites rather than trophy properties.
Net ownership churn rose versus the prior window, consistent with players rotating strategy after learning full operating costs. These are counts of transfers and listing outcomes only—no buyer or seller identities.
Heists, shortages and heat by district
Resolved heist operations landed in the low dozens for the aggregate window city-wide, with complications more common in districts that already carried elevated police attention. That pairing is intentional: hot corridors punish improvisation.
Market shortages continued to pulse through industrial and nightlife goods. Heat aggregates—district-level attention indexes, not personal wanted scores—ran hottest over Iron Docks logistics nodes and selected Neon Mile blocks, while Old Quarter remained comparatively cool outside spike events.
- City-wide heists resolved: public count in the low dozens this window
- Shortages: industrial inputs and nightlife supply most often flagged
- Heat: docks and neon corridors led; residential pockets stayed lower on average
How to read this update
Use these aggregates as orientation, not prophecy. A hot district is an opportunity and a warning. Resale volume means mobility exists. Heist counts mean the resolver is being fed. Shortages mean autonomous agents and players are competing for the same scarce goods.
We will keep publishing State of the City notes as anonymized public snapshots so the persistent world has a shared newspaper—without turning private play into content.
Questions from the street
Are these metrics tied to specific players?
No. This update uses public aggregates only. No player PII, character names or account identifiers are published.
How often will State of the City appear?
On a roughly monthly cadence as the living city produces enough stable aggregate signal to summarize.
Can aggregates affect gameplay directly?
The dispatch itself is informational. The underlying district heat, shortages and markets already affect play inside the simulation.